Data
We need to understand what data could be, the type of data, how to store data based on its type, and how to use data for analysis (EDA).
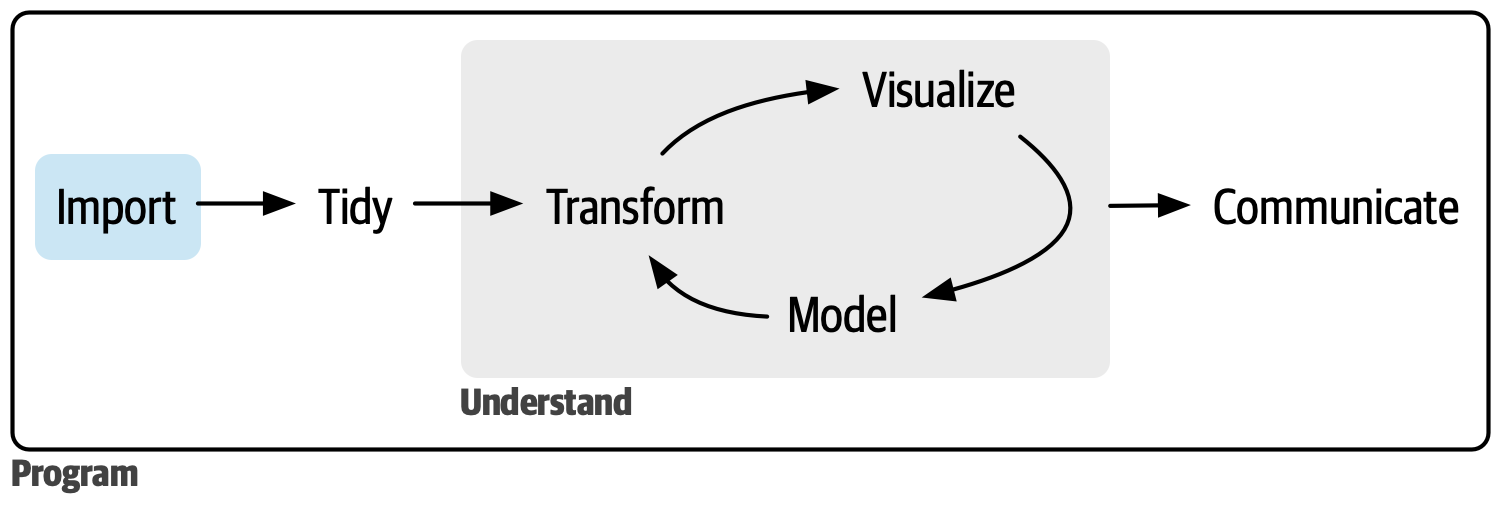
As data analysts we have to be concerned about the data. If you look at the image below, long before we get a chance to import the data, the data needs to be collected.

Some of you might not have a hand in the collection process, some might have a position where you are lucky enough to have a say in how the data is collected. Why wouldn’t you make an effort in collecting the right data, the right way?
In this section we’ll go back and understand why we collect data and the steps we should take to ensure the data is valuable and valid.
First off what’s a Data Analyst/Scientist, what skills are required, what do they go through, what type of porjects do they work on? We’ll go through a quick definition of what a Data Analyst/Scientist is.
We’ll start with experimental design where we learn how to setup an experiment to not only understand which data to collect but what’s the best way to go about collecting it.
Next, we’ll cover the roadmap an analyst takes when starting a analysis project. The five steps to data analysis: Ask, Prepare, Process, Analyze, Share, and Act
We follow the roadmap with a more detailed explanation of each of the five steps of a project. Even though we’ll cover the analyze stage here, we’ll dive deeper into Exploratory, and Predictive analysis in a later chapter once we cover the programming language we’ll be using. Suffice to say, we’ll cover the different types of data analysis: Descriptive, Exploratory, Inferential, Predictive, Causal, Mechanistic (we’ll refer to Exploratory Data Analysis as EDA).
Recap
- There are three main data categories. These include: structured, unstructured, and semi-structured.
- Data repositories store and manage data centrally, including relational and non-relational databases.
- Information Models provide abstract representations of entities and relationships, whereas Data Models serve as blueprints for practical database structures.
- An Entity-Relationship Diagram (ERD) is a visual representation that illustrates the relationships and interactions between entities in a database.
- The fundamental components that form the structure of a relationship include entities, relationship sets, and crow’s foot notations..
- Sets characterized by their unordered collections include operations such as membership, subsets, union, and intersection.
- Relations describe connections between set elements and consist of two essential components: The Relation Schema and the Relation Instance.
Relations
Tables in a database schema are called relations
Degree of a Relation
Degree refers to the number of attributes or columns in a relation/table in a db
Cardinality
Cardinality refers to the number of tuples, or rows in a relation/table
Attributes
A relational schema specifies each column’s relation name and type, as its attributes