wget https://cf-courses-data.s3.us.cloud-object-storage.appdomain.cloud/example-guided-project/flights_RUSSIA_small.sqlTroubleshooting PostgreSQL
In this example we’ll work on troubleshooting common issues you may encounter as a database administrator. The most common problems encountered with databases are caused by poor performance, improper configuration, or poor connectivity. You will use a PostgreSQL server instance to explore some of these possible problems and rectify them.
Create DB
Data
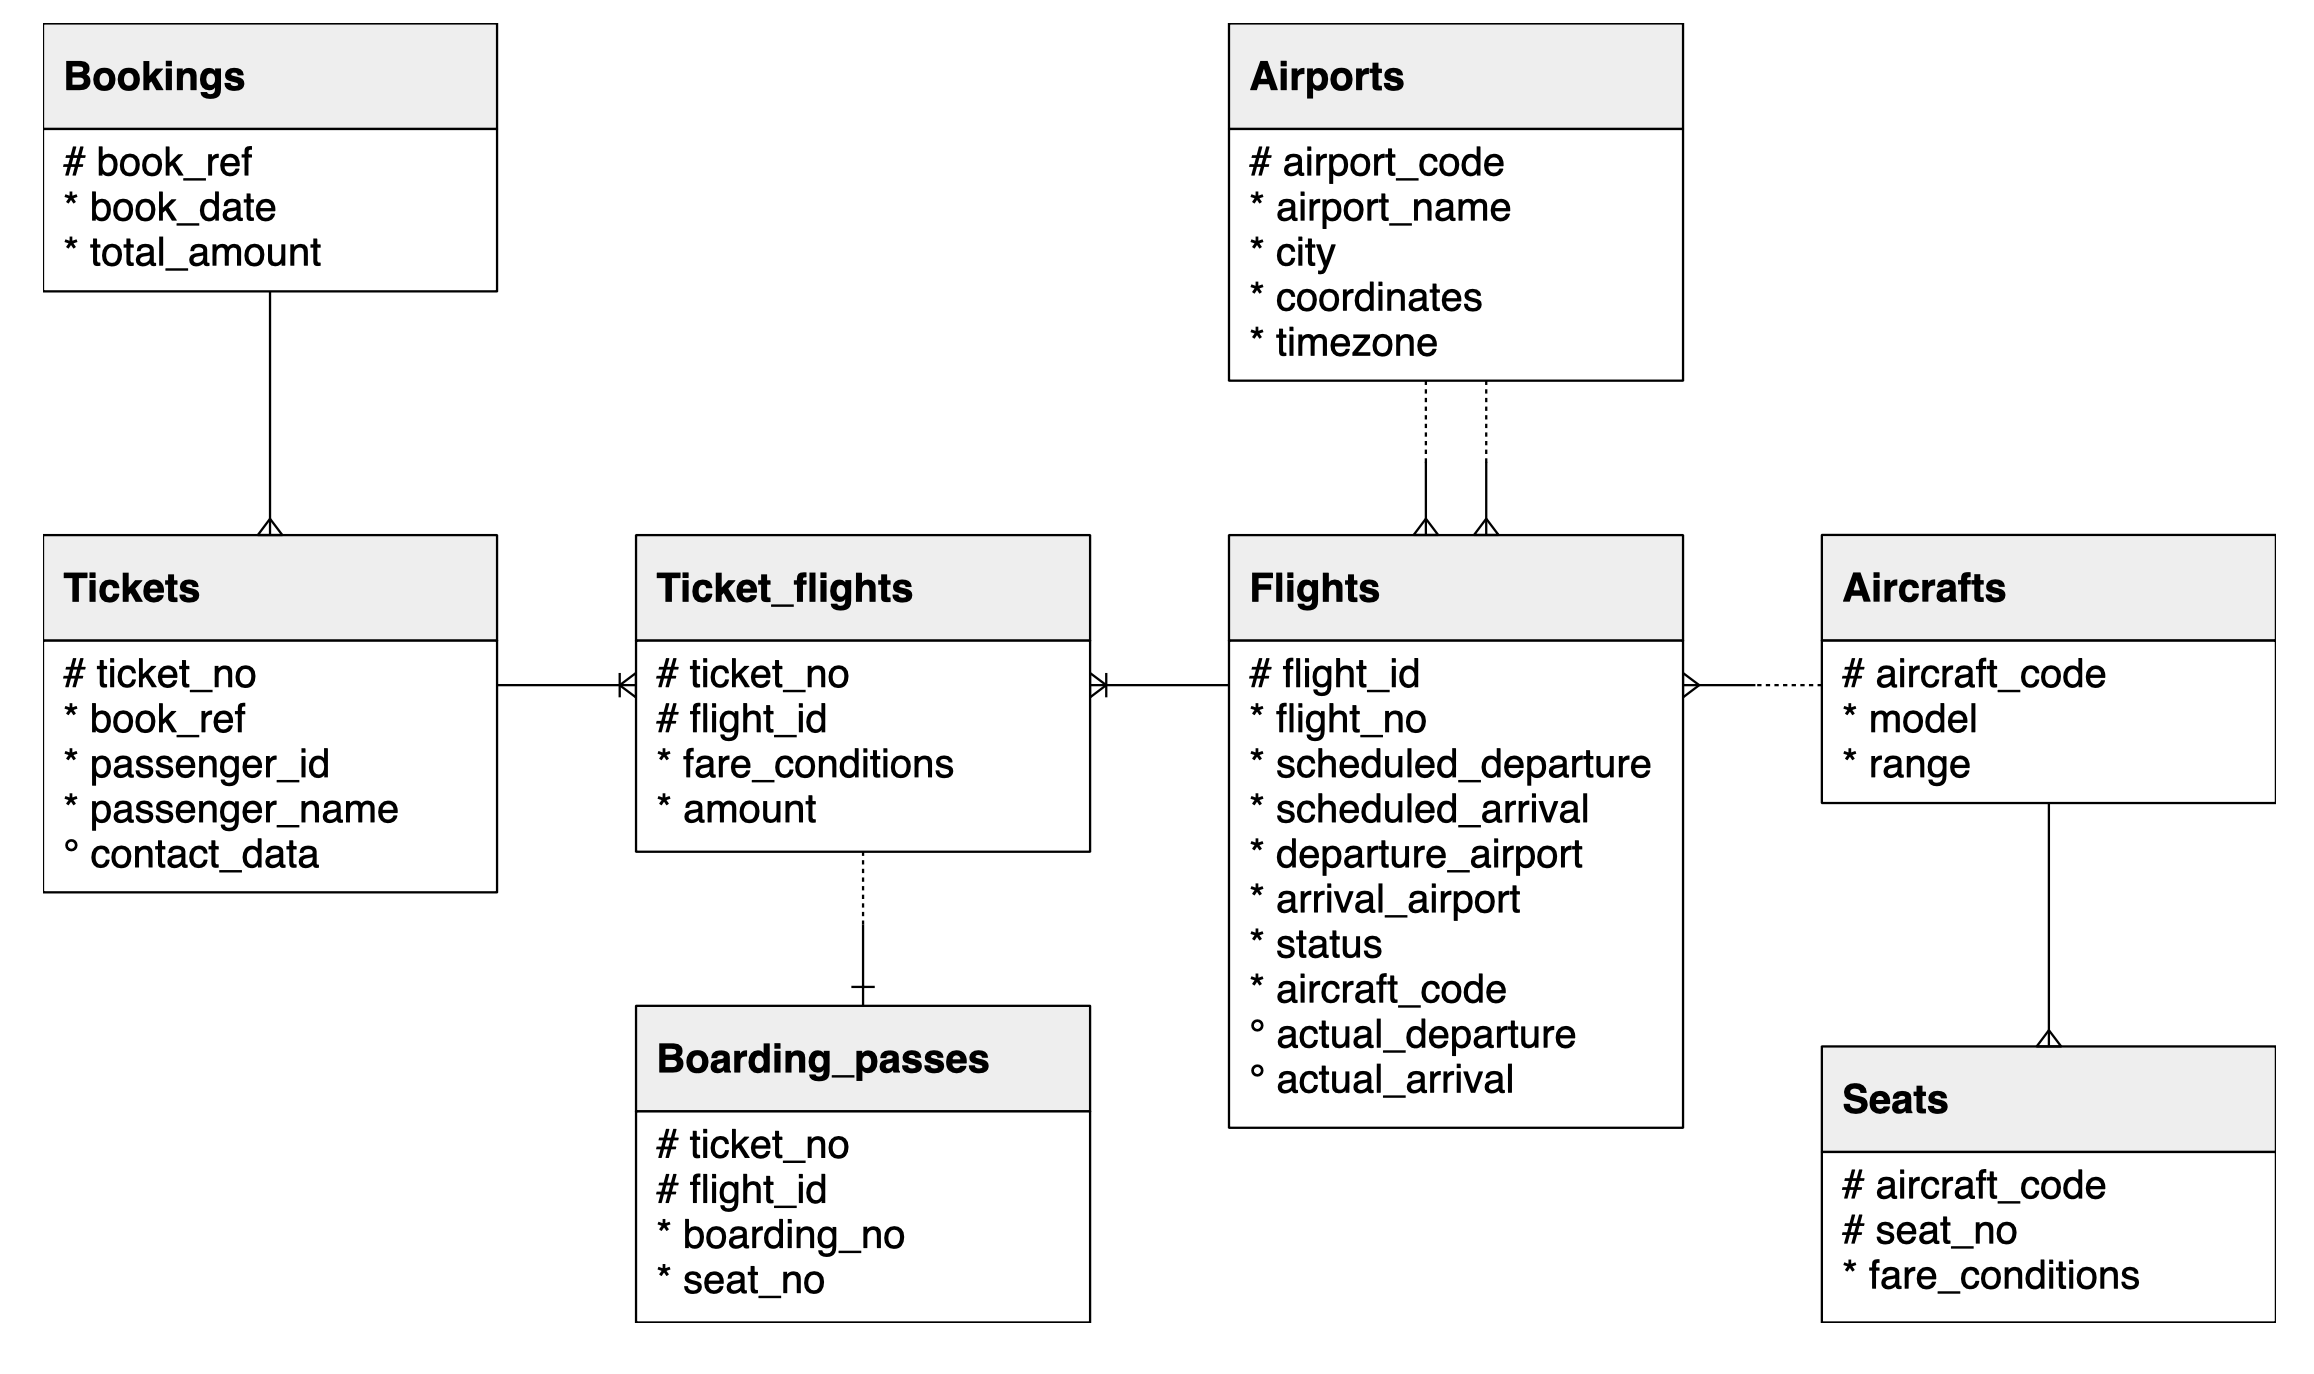
We’ve used this db before, a database from https://postgrespro.com/education/demodb distributed under the PostgreSQL license. It stores a month of data about airline flights in Russia and is organized according to the following schema

- Start server instance in the cloud
- Open new terminal
- Download data
- Open Postgre CLI
Create db
postgres=# \i flights_RUSSIA_small.sqlView Tables
demo=# \dt
               List of relations
  Schema  |      Name       | Type  |  Owner
----------+-----------------+-------+----------
 bookings | aircrafts_data  | table | postgres
 bookings | airports_data   | table | postgres
 bookings | boarding_passes | table | postgres
 bookings | bookings        | table | postgres
 bookings | flights         | table | postgres
 bookings | seats           | table | postgres
 bookings | ticket_flights  | table | postgres
 bookings | tickets         | table | postgres
(8 rows)
Enable Error Logging
Enable Server Logging
- First, to enable error logging on your PostgreSQL server instance, you will need to configure your server to support it.
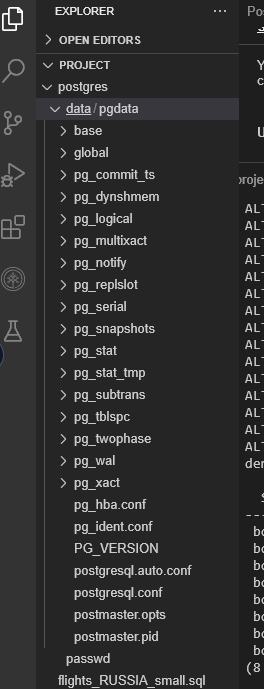
- You can do so by using the Cloud IDE file explorer to open
postgresql.conf, which stores the configuration parameters that are read upon server startup. Let’s go ahead and do it. - You can open the file by first opening the file explorer on Cloud IDE then selecting
postgres > data > postgresql.conf

- With the configuration file open, scroll down to line 431.
- Replace
logging_collector = offwithlogging_collector = onand uncomment the parameter by removing the#before the line.

- Restart the server by first STOP
- Wait till status is INACTIVE
- Then START
- Open server CLI
Confirm Alteration
postgres=# SHOW logging_collector;
 logging_collector
-------------------
 on
(1 row)
View Server Logs
We will navigate the Cloud IDE file explorer to open up and inspect the server logs created after you enabled the logging in the previous task. The logs can be a valuable tool when troubleshooting issues as a database administrator. For now, let’s look at the logs created during normal operation, with nothing broken yet.
- To find where the system logs are stored, enter the following command into the CLI:
postgres=# SHOW log_directory;
 log_directory
---------------
 log
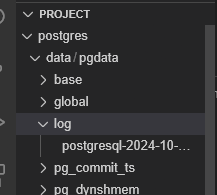
(1 row)- Open up the file explorer on Cloud IDE and navigate through postgres > data > log.
- You will see a file with a name of the form
postgresql-YYYY-MM-DD-<numbers>.log. Go ahead and open it.

- Inspect and familiarize yourself with the logs given for a PostgreSQL server startup.
- Every time you start the server again, a new
.logfile will be created in the log folder. - Here is a copy
2024-10-03 20:15:37.904 UTC [1] LOG:  starting PostgreSQL 13.2 on x86_64-pc-linux-musl, compiled by gcc (Alpine 10.2.1_pre1) 10.2.1 20201203, 64-bit
2024-10-03 20:15:37.904 UTC [1] LOG:  listening on IPv4 address "0.0.0.0", port 5432
2024-10-03 20:15:37.904 UTC [1] LOG:  listening on IPv6 address "::", port 5432
2024-10-03 20:15:37.912 UTC [1] LOG:  listening on Unix socket "/var/run/postgresql/.s.PGSQL.5432"
2024-10-03 20:15:37.923 UTC [14] LOG:  database system was shut down at 2024-10-03 20:15:15 UTC
2024-10-03 20:15:37.929 UTC [1] LOG:  database system is ready to accept connections
2024-10-03 20:17:01.899 UTC [134] FATAL:  password authentication failed for user "postgres"
2024-10-03 20:17:01.899 UTC [134] DETAIL:  Password does not match for user "postgres".
    Connection matched pg_hba.conf line 99: "host all all all md5"
Test Performance
The most common problems encountered with databases are caused by poor performance, improper configuration, or poor connectivity. Server configuration issues, such as inadequate hardware resources or misconfigured settings, can significantly impact performance. In this exercise, we will gain some hands-on experience in studying the performance of the PostgreSQL server and inspecting the logs to identify and resolve slow performance and connection disruptions.
Edit Conf File
Before you get started, you’ll have to set up a few things so that you can begin troubleshooting. In this task, you will first delete the postgresql.conf file and replace it with a new configuration file that has some parameters changed. This task is entirely setup and will allow you to complete the remainder of the tasks where you will test the performance of the server.
Download new conf file
- In a new terminal
wget https://cf-courses-data.s3.us.cloud-object-storage.appdomain.cloud/IBM-DB0231EN-SkillsNetwork/labs/PostgreSQL/Lab%20-%20Troubleshooting/postgresql.conf- Open up the file explorer on Cloud IDE and navigate to postgres > data.
- Right-click
postgresql.confin this directory and select Delete. - In the file explorer, you will see the
postgresql.conffile you downloaded in Step 1 sitting in the root directory. - Drag it into the postgres > data directory, as shown below.

- Now START the server
Server Performance
We will run a few SQL commands and analyze the server’s performance, inspect the error logs, then finally, identify and resolve issues that could be hindering the performance of the database.
- Let’s try running some queries on the database and analyze its performance.
- First, open up the PostgreSQL command line interface (CLI) by selecting the PostgreSQL CLI button.
- connect to db
postgres=# \connect demo
psql (15.2 (Ubuntu 15.2-1.pgdg18.04+1), server 13.2)
You are now connected to database "demo" as user "postgres".
demo=#
Enable the Timer
demo=# \timing
Timing is on.
Run Query 1
demo=# SELECT * FROM aircrafts_data;
 aircraft_code |             model             | range
---------------+-------------------------------+-------
 773           | {"en": "Boeing 777-300"}      | 11100
 763           | {"en": "Boeing 767-300"}      |  7900
 SU9           | {"en": "Sukhoi Superjet-100"} |  3000
 320           | {"en": "Airbus A320-200"}     |  5700
 321           | {"en": "Airbus A321-200"}     |  5600
 319           | {"en": "Airbus A319-100"}     |  6700
 733           | {"en": "Boeing 737-300"}      |  4200
 CN1           | {"en": "Cessna 208 Caravan"}  |  1200
 CR2           | {"en": "Bombardier CRJ-200"}  |  2700
(9 rows)

Time: 3.881 ms
Run Query 2
Let’s try something a little more computationally heavy and see how the server handles it. The following command goes through each element in the boarding_passes table and reassigns each value to itself. In other words, it does not change the table but allows you to see how the server handles this task. Enter the following into the CLI
- This heavier command took almost a minute to execute–a fairly long time, but the server was nonetheless able to complete the command.
- Still, you may want to improve this performance.
demo=# UPDATE boarding_passes SET ticket_no = ticket_no, flight_id = flight_id, boarding_no = boarding_no, seat_no = seat_no;
UPDATE 579686
Time: 77818.620 ms (01:17.819)
Additional Users
- Now, as the database administrator, you will likely not be the only one who needs to access the database you are working with.
- Other users will likely need to connect to the database for a wide variety of reasons, including retrieving and inputting data.
- Let’s simulate additional users connecting to the database.
- You can do this by opening additional PostgreSQL CLI terminals in Cloud IDE, as each one establishes a new connection to the server.
- Click PostgreSQL CLI three times, opening three new CLI terminals:
- After clicking the button the third time, you will be presented with the following message in the new terminal:

- What happened here? Let’s do some investigating and find out what the issue is, but first, go ahead and close all the terminals you opened up.
Troubleshoot
In the previous exercise, you encountered a problem and the server shut down. Now it’s time to figure out what happened, why it happened, and how to fix it so that it does not happen again.
Task A: Diagnose the Issue
- First, let’s check the server logs to see what happened. Open up the Cloud IDE file explorer and navigate to postgres > data > log.
- Since you restarted the server in the previous exercise, a new log file will have been created for this new session. Open up the most recent one.
- Inspect the most recent log
2024-10-03 20:26:04.114 UTC [1] LOG:  starting PostgreSQL 13.2 on x86_64-pc-linux-musl, compiled by gcc (Alpine 10.2.1_pre1) 10.2.1 20201203, 64-bit
2024-10-03 20:26:04.115 UTC [1] LOG:  listening on IPv4 address "0.0.0.0", port 5432
2024-10-03 20:26:04.115 UTC [1] LOG:  listening on IPv6 address "::", port 5432
2024-10-03 20:26:04.122 UTC [1] LOG:  listening on Unix socket "/var/run/postgresql/.s.PGSQL.5432"
2024-10-03 20:26:04.131 UTC [14] LOG:  database system was shut down at 2024-10-03 20:25:50 UTC
2024-10-03 20:26:04.143 UTC [1] LOG:  database system is ready to accept connections
2024-10-03 20:27:25.798 UTC [138] FATAL:  password authentication failed for user "postgres"
2024-10-03 20:27:25.798 UTC [138] DETAIL:  Password does not match for user "postgres".
    Connection matched pg_hba.conf line 99: "host all all all md5"
2024-10-03 20:34:17.812 UTC [723] FATAL:  sorry, too many clients already
2024-10-03 20:34:18.987 UTC [724] FATAL:  sorry, too many clients already
2024-10-03 20:34:22.879 UTC [731] FATAL:  sorry, too many clients already
2024-10-03 20:34:24.126 UTC [732] FATAL:  sorry, too many clients already
2024-10-03 20:34:24.142 UTC [733] FATAL:  sorry, too many clients already
2024-10-03 20:34:24.174 UTC [734] FATAL:  sorry, too many clients already
2024-10-03 20:34:27.946 UTC [741] FATAL:  sorry, too many clients already
As you can see, some error logs were created from opening that last CLI terminal, with the message
FATAL: sorry, too many clients already.This message is repeated several times as the connection is repeatedly attempting to re-establish.
Some of the most common connectivity problems are not being able to connect to the database server, the database server or instance not running properly, and client login credentials being incorrect. You can likely rule out the last two, since the login credentials are automatically inputted for us on Cloud IDE and you know that the server instance is running properly, since you are already connected to it on 3 other terminals. This likely means you could be experiencing some problems connecting to the database server when you open the fourth connection. But why is this?
Server configuration issues, such as inadequate hardware resources or misconfigured settings, can significantly impact performance. Perhaps this could explain the connection problem as well as the slow performance you saw on the database query earlier. Let’s take a look at the server configuration and see if you can spot anything.
Using the Cloud IDE file explorer, navigate to postgres > data and open the postgresql.conf configuration file.
Scroll down till you get to about line 64: max_connections = 4
AH HA!
So the problem is improper server configuration
Task B: Resolve the Issue
- Edit line 64 to let’s say = 100 which is the standard for most uses, unless !!
- Since we increased the user number we will need to increase shared_buffers parameters
- which sets the amount of memory the database server has at its disposal for shared memory buffers. Scroll down to line 121 to find the shared_buffers parameter.
- Notice that the parameter is set to 128kB, which is the minimum value.
- Increase the available memory by changing the shared_buffers parameter from 128kB to 128MB.
- While you’re at it, you can also increase the server performance so that the slow query you executed in Exercise 3 will run more quickly.
- Increase the work_mem parameter from the minimum 64kB to 4MB (line 130)
- Change the maintenance_work_mem from the minimum 1MB to a more standard 64MB.(line 132)
- Save the changes to
postgresql.confby either navigating to File > Save at the top toolbar or by pressing Ctrl + S (Mac: ⌘ + S). - Close all open terminal tabs and stop the PostgreSQL server by selecting the Stop button.
Retest
- Let’s go back and retest the second query above and see if anything changes
- Restart server
- Open server CLI
- connect to db
- enable timing
Query 1 - Retest
postgres=# \connect demo
psql (15.2 (Ubuntu 15.2-1.pgdg18.04+1), server 13.2)
You are now connected to database "demo" as user "postgres".
demo=# \timing
Timing is on.
demo=# SELECT * FROM aircrafts_data;
 aircraft_code |             model             | range
---------------+-------------------------------+-------
 773           | {"en": "Boeing 777-300"}      | 11100
 763           | {"en": "Boeing 767-300"}      |  7900
 SU9           | {"en": "Sukhoi Superjet-100"} |  3000
 320           | {"en": "Airbus A320-200"}     |  5700
 321           | {"en": "Airbus A321-200"}     |  5600
 319           | {"en": "Airbus A319-100"}     |  6700
 733           | {"en": "Boeing 737-300"}      |  4200
 CN1           | {"en": "Cessna 208 Caravan"}  |  1200
 CR2           | {"en": "Bombardier CRJ-200"}  |  2700
(9 rows)

Time: 1.094 ms

# As you can see the time went down from 3.881 ms
Query 2 - Retest
demo=# UPDATE boarding_passes SET ticket_no = ticket_no, flight_id = flight_id, boarding_no = boarding_no, seat_no = seat_no;

UPDATE 579686
Time: 9840.289 ms (00:09.840)

# Previous results
UPDATE 579686
Time: 77818.620 ms (01:17.819)