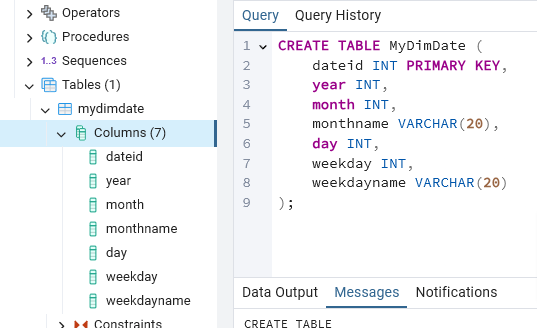
CREATE TABLE MyDimDate (
    dateid INT PRIMARY KEY,
    year INT,
    month INT,
    monthname VARCHAR(20),
    day INT,
    weekday INT,
    weekdayname VARCHAR(20)
);Create DW for Electronic Retailer
In this project we’ll:
Develop dimension and fact tables to organize and structure data for analysis
Employ SQL queries to create and load data into dimension and fact tables
Create materialized views to optimize query performance
Scenario
You are a data engineer hired by a consumer electronics retail company. The company sells various electronic products through its online and offline channels across major cities in the United States. They operate multiple stores and warehouses to manage their inventory and sales operations. The company wants to create a data warehouse to analyze its sales performance and inventory management and aim to generate reports, such as:
- Total sales revenue per year per city
- Total sales revenue per month per city
- Total sales revenue per quarter per city
- Total sales revenue per year per product category
- Total sales revenue per product category per city
- Total sales revenue per product category per store
We will use PostgreSQL and the pgAdmin specifically to accomplish our tasks. We’ll name the database: practice
Tasks
We’ll perform the following tasks using our understanding of dimensional modeling, SQL querying, and data warehousing concepts:
Task 1: Design the dimension table DimDate
Task 2: Design the dimension table DimProduct
Task 3: Design the dimension table DimCustomerSegment
Task 4: Design the fact table FactSales
Task 5: Create the dimension table DimDate
Task 6: Create the dimension table DimProduct
Task 7: Create the dimension table DimCustomerSegment
Task 8: Create the fact table FactSales
Task 9: Load data into the dimension table DimDate
Task 10: Load data into the dimension table DimProduct
Task 11: Load data into the dimension table DimCustomerSegment
Task 12: Load data into the fact table FactSales
Task 13: Create a grouping sets query
Task 14: Create a rollup query
Task 15: Create a cube query using the columns year, city, productid, average sales revenue
Task 16: Create a materialized view named max_sales using the columns city, productid, product type, and max sales.
Design Star Schema DW
Data
Here is a partial view of the data provided:
| Sales ID | Product Type | Price Per Unit | Quantity Sold | City | Date |
|---|---|---|---|---|---|
| 001 | Electronics | $299.99 | 30 | New York | 2024-04-01 |
| 002 | Apparel | $49.99 | 50 | Los Angeles | 2024-04-01 |
| 003 | Furniture | $399.99 | 10 | Chicago | 2024-04-02 |
| 004 | Electronics | $199.99 | 20 | Houston | 2024-04-02 |
| 005 | Groceries | $2.99 | 100 | Miami | 2024-04-03 |
DimDate -T1
Design the dimension table MyDimDate to provide the company with granularity of day, which means they would like to have the ability to generate teh report on a yearly, monthly, daily, and weekday basis.
Here is a list of the fields in DimDate that I came up with:
- dateid
- year
- month
- monthname
- day
- weekday
- weekdayname
MyDimProduct -T2
It would be wise to link the Fact table with a product table using a productid, in the event that other product segments are added in the future, all we do is update MyDimProduct table instead of the Fact table, by simply adding another productname for the new productid. So this table will have the following attributes:
- productid
- productname
MyDimCustSegment - T3
It is apparent from the product types in the data above, that the company retails products from different segments: apparel, groceries…. Considering the fact that the company is a consumer electronics retailer it is extremely important to be able to separate each order by a specific segment. This will be helpful in segment analysis
- segmentid
- segmentname
MyFactSales - T4
Now with all the dimensions covered in their own tables we can detail the Fact table which will provide facts about each sale with salesid being the primary key, and 3 foreign keys from the dimension tables (NOTE: we were instructed that city will be dropped from the db! so we’ll ignore it)
- salesid
- productid
- quantitysold
- priceperunit
- segmentid
- dateid
Create Tables Schema
MyDimDate - T5
Use this to create the table
MyDimProduct - T6
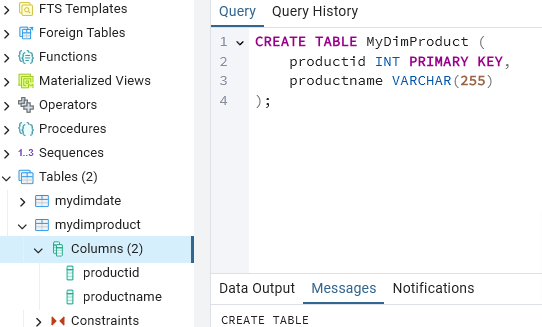
CREATE TABLE MyDimProduct (
    productid INT PRIMARY KEY,
    productname VARCHAR(255)
);
MyDimCustSegment - T7
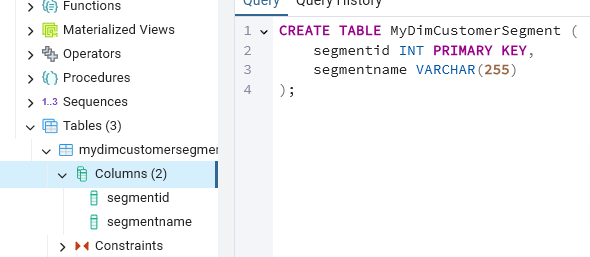
CREATE TABLE MyDimCustomerSegment (
    segmentid INT PRIMARY KEY,
    segmentname VARCHAR(255)
);
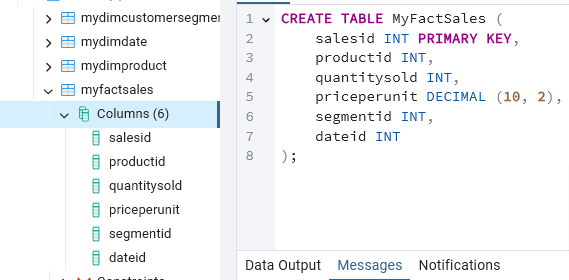
MyFactSales - T8
CREATE TABLE MyFactSales (
    salesid INT PRIMARY KEY,
    productid INT,
    quantitysold INT,
    priceperunit DECIMAL (10, 2),
    segmentid INT,
    dateid INT
);
Change Schema
After the initial schema design, you were informed that data could not be collected in the format initially planned due to operational issues. This means that the previous tables (MyDimDate, MyDimProduct, MyDimCustomerSegment, MyFactSales) in the practice database and their associated attributes are no longer applicable to the current design. The company has now provided data in CSV files according to the new design.
You will need to load the data provided by the company in CSV format.
- First, create a new database named PracProj
- Then create the tables DimDate, DimProduct, DimCustomerSegment, and FactSales as per the new schema.
Data
- Download the data for DimDate from here
- Load the data into DimDate table
Recreate & Populate
DimDate - T9
We’ll import data from csv file
- From pgAdmin > create a new database > name it: PracProj
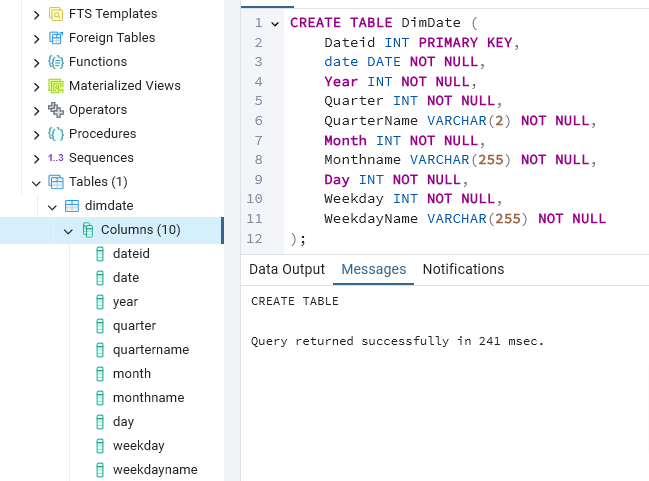
- Create the DimDate Table once again in this new db using
- As you can see 3 more columns were added from the original 7 columns
CREATE TABLE DimDate (
    Dateid INT PRIMARY KEY,
    date DATE NOT NULL,
    Year INT NOT NULL,
    Quarter INT NOT NULL,
    QuarterName VARCHAR(2) NOT NULL,
    Month INT NOT NULL,
    Monthname VARCHAR(255) NOT NULL,
    Day INT NOT NULL,
    Weekday INT NOT NULL,
    WeekdayName VARCHAR(255) NOT NULL
);
- Use the import tool from within the table to import the csv file into the table
- Upload the file to this path: /var/lib/pgadmin/
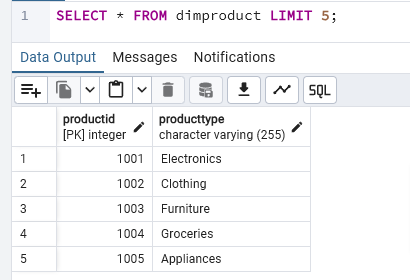
- Preview the first 5 rows of the table

DimProduct - T10
We’ll import data from csv file
- Data can be found here
- Replicate the procedure in T9 above
CREATE TABLE DimProduct (
    Productid INT PRIMARY KEY,
    Producttype VARCHAR(255) NOT NULL
);
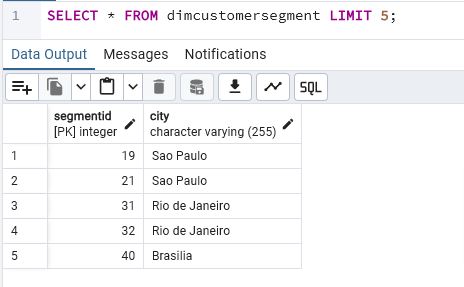
DimCustSegment - T11
- Data can be found here
- Create table with code below
- Populate by importing as we did above
- View first 5 rows
CREATE TABLE DimCustomerSegment (
    Segmentid INT PRIMARY KEY,
    City VARCHAR(255) NOT NULL
);
FactSales - T12
- Data can be found here
- Create table with code below
- Populate by importing as we did above
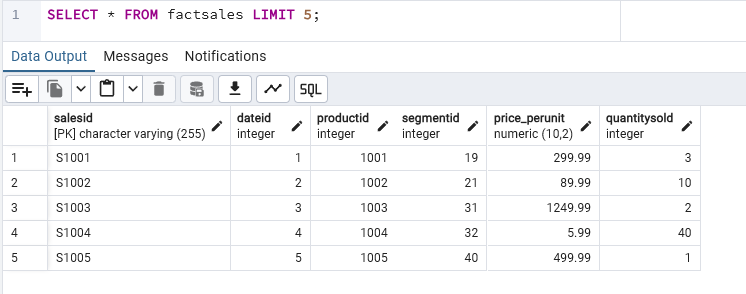
- View first 5 rows
CREATE TABLE FactSales (
    Salesid VARCHAR(255) PRIMARY KEY,
    Dateid INT NOT NULL,
    Productid INT NOT NULL,
    Segmentid INT NOT NULL,
    Price_PerUnit DECIMAL(10, 2) NOT NULL,
    QuantitySold INT NOT NULL,
    FOREIGN KEY (Dateid) REFERENCES DimDate(Dateid),
    FOREIGN KEY (Productid) REFERENCES DimProduct(Productid),
    FOREIGN KEY (Segmentid) REFERENCES DimCustomerSegment(Segmentid)
);
Aggregation Queries
Grouping Sets - T13
Create a grouping sets query using the columns productid, producttype, total sales.
In this query:
- You’re joining FactSales ‘f’ with DimProduct ‘p’ on their productid to correlate each sale with its product type.
- You’re using GROUPING SETS to specify the different levels of aggregation:
- – By both Productid and Producttype
- – By Productid alone
- – By Producttype alone
- – And a grand total with (), which doesn’t group by any column and hence returns the sum for all sales.
- You’re calculating TotalSales by multiplying the Price_PerUnit by QuantitySold for each sale.
- The ORDER BY clause ensures the results are ordered by productid and then by producttype.
- The output has 46 rows some of which are shown below
SELECT
    p.Productid,
    p.Producttype,
    SUM(f.Price_PerUnit * f.QuantitySold) AS TotalSales
FROM
    FactSales f
INNER JOIN
    DimProduct p ON f.Productid = p.Productid
GROUP BY GROUPING SETS (
    (p.Productid, p.Producttype),
    p.Productid,
    p.Producttype,
    ()
)
ORDER BY
    p.Productid,
    p.Producttype;
Rollup Query - T14
Create a rollup query using the columns year, city, productid, and total sales. Take a screenshot of the SQL and the output rows.
This query performs the following operations:
- Joins FactSales with DimDate on Dateid, DimProduct on Productid, and DimCustomerSegment on Segmentid.
- Selects the year from DimDate, the city from DimCustomerSegment, and the product ID from DimProduct.
- Calculates total sales by multiplying the price per unit by the quantity sold for each sales entry.
- Groups the results using the ROLLUP function to create a grouping set that includes all combinations of year, city, and productid, along with their respective subtotals and a grand total for all sales.
- The ORDER BY clause ensures the results are first ordered by year in descending order, then by city and product ID.
- The output has 28 rows some of which are shown below
SELECT
    d.Year,
    cs.City,
    p.Productid,
    SUM(f.Price_PerUnit * f.QuantitySold) AS TotalSales
FROM
    FactSales f
JOIN
    DimDate d ON f.Dateid = d.Dateid
JOIN
    DimProduct p ON f.Productid = p.Productid
JOIN
    DimCustomerSegment cs ON f.Segmentid = cs.Segmentid
GROUP BY ROLLUP (d.Year, cs.City, p.Productid)
ORDER BY
    d.Year DESC,
    cs.City,
    p.Productid;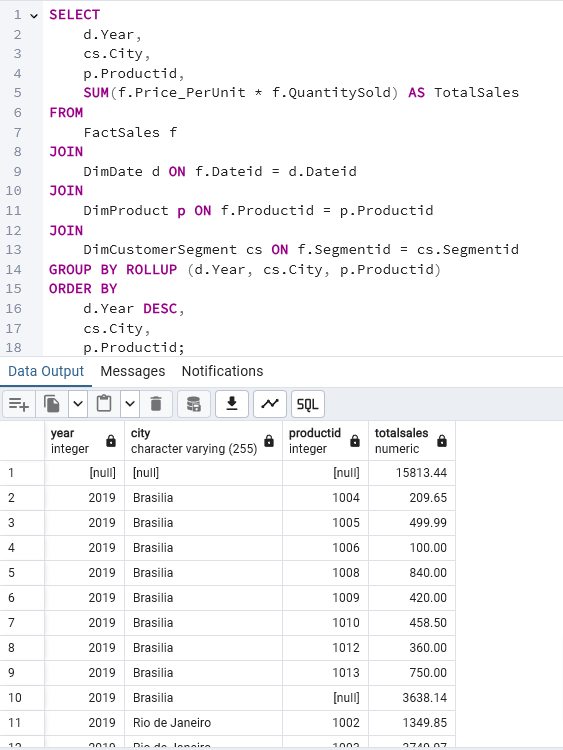
Cube Query - T15
Create a cube query using the columns year, city, productid, and average sales.
- The CUBE clause is used in the GROUP BY to create subtotals for all combinations of year, city, and productid in addition to the grand total across all groups.
- AVG(f.Price_PerUnit * f.QuantitySold) calculates the average sales, factoring in both the price per unit and the quantity sold.
- INNER JOIN is used to join the FactSales table with the dimension tables DimDate, DimProduct, and DimCustomerSegment.
- Output is 84 rows long
SELECT
    d.Year,
    cs.City,
    p.Productid,
    AVG(f.Price_PerUnit * f.QuantitySold) AS AverageSales
FROM
    FactSales f
INNER JOIN
    DimDate d ON f.Dateid = d.Dateid
INNER JOIN
    DimProduct p ON f.Productid = p.Productid
INNER JOIN
    DimCustomerSegment cs ON f.Segmentid = cs.Segmentid
GROUP BY CUBE (d.Year, cs.City, p.Productid);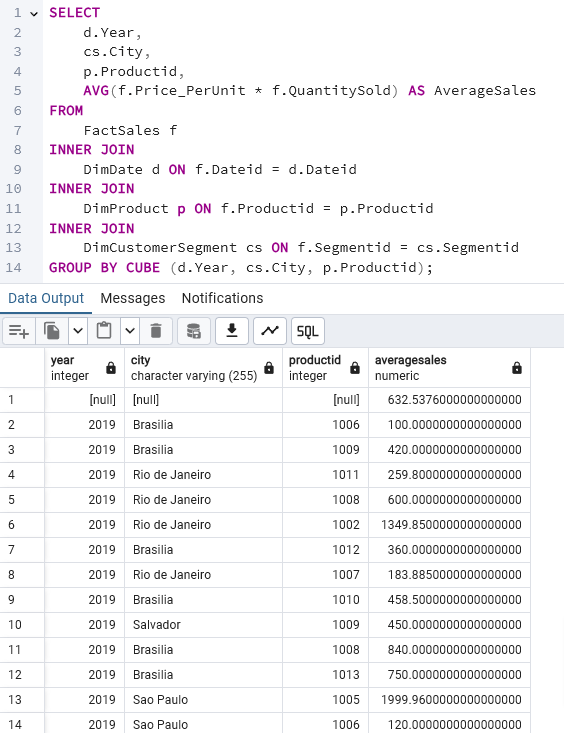
Materialized View
Max_sales View - T16
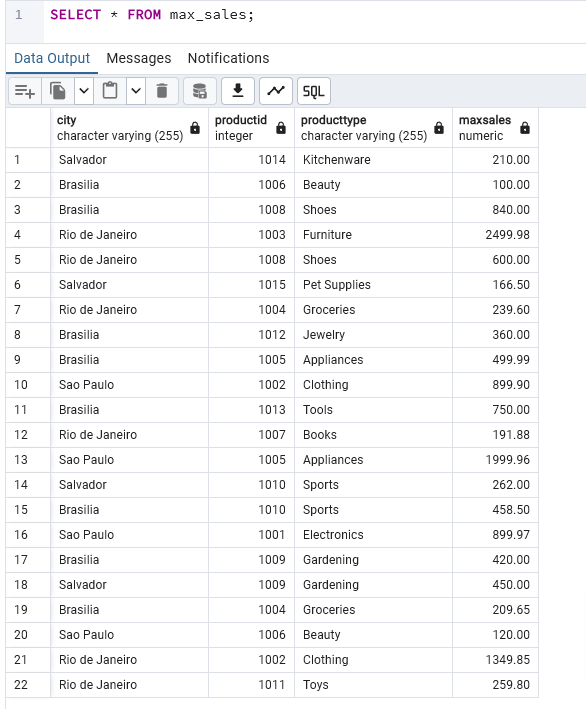
Create an materialized view named max_sales using the columns city, productid, producttype, and max sales.
- This statement will create the materialized view and populate it with the current data from the joined tables.
- The WITH DATA clause tells PostgreSQL to fill the view with the query results immediately.
- If you wanted to create the view without filling it with data, you would use WITH NO DATA.
CREATE MATERIALIZED VIEW max_sales AS
SELECT
    cs.City,
    p.Productid,
    p.Producttype,
    MAX(f.Price_PerUnit * f.QuantitySold) AS MaxSales
FROM
    FactSales f
JOIN
    DimProduct p ON f.Productid = p.Productid
JOIN
    DimCustomerSegment cs ON f.Segmentid = cs.Segmentid
GROUP BY
    cs.City,
    p.Productid,
    p.Producttype
WITH DATA;
Refresh View
Refresh the view and print it out
REFRESH MATERIALIZED VIEW max_sales;