wget https://cf-courses-data.s3.us.cloud-object-storage.appdomain.cloud/example-guided-project/flights_RUSSIA_small.sql

# for local server go to directory
/mnt/d/data$ wget https://cf-courses-data.s3.us.cloud-object-storage.appdomain.cloud/example-guided-project/flights_RUSSIA_small.sql
--2024-10-03 08:03:31--  https://cf-courses-data.s3.us.cloud-object-storage.appdomain.cloud/example-guided-project/flights_RUSSIA_small.sql
Resolving cf-courses-data.s3.us.cloud-object-storage.appdomain.cloud (cf-courses-data.s3.us.cloud-object-storage.appdomain.cloud)... 169.63.118.104
Connecting to cf-courses-data.s3.us.cloud-object-storage.appdomain.cloud (cf-courses-data.s3.us.cloud-object-storage.appdomain.cloud)|169.63.118.104|:443... connected.
HTTP request sent, awaiting response... 200 OK
Length: 103865229 (99M) [application/x-sql]
Saving to: ‘flights_RUSSIA_small.sql’

flights_RUSSIA_small.sql      100%[=================================================>]  99.05M  3.72MB/s    in 49s

2024-10-03 08:04:21 (2.01 MB/s) - ‘flights_RUSSIA_small.sql’ saved [103865229/103865229]Postgre CLI
PostgreSQL Monitoring
Setup Db
Data
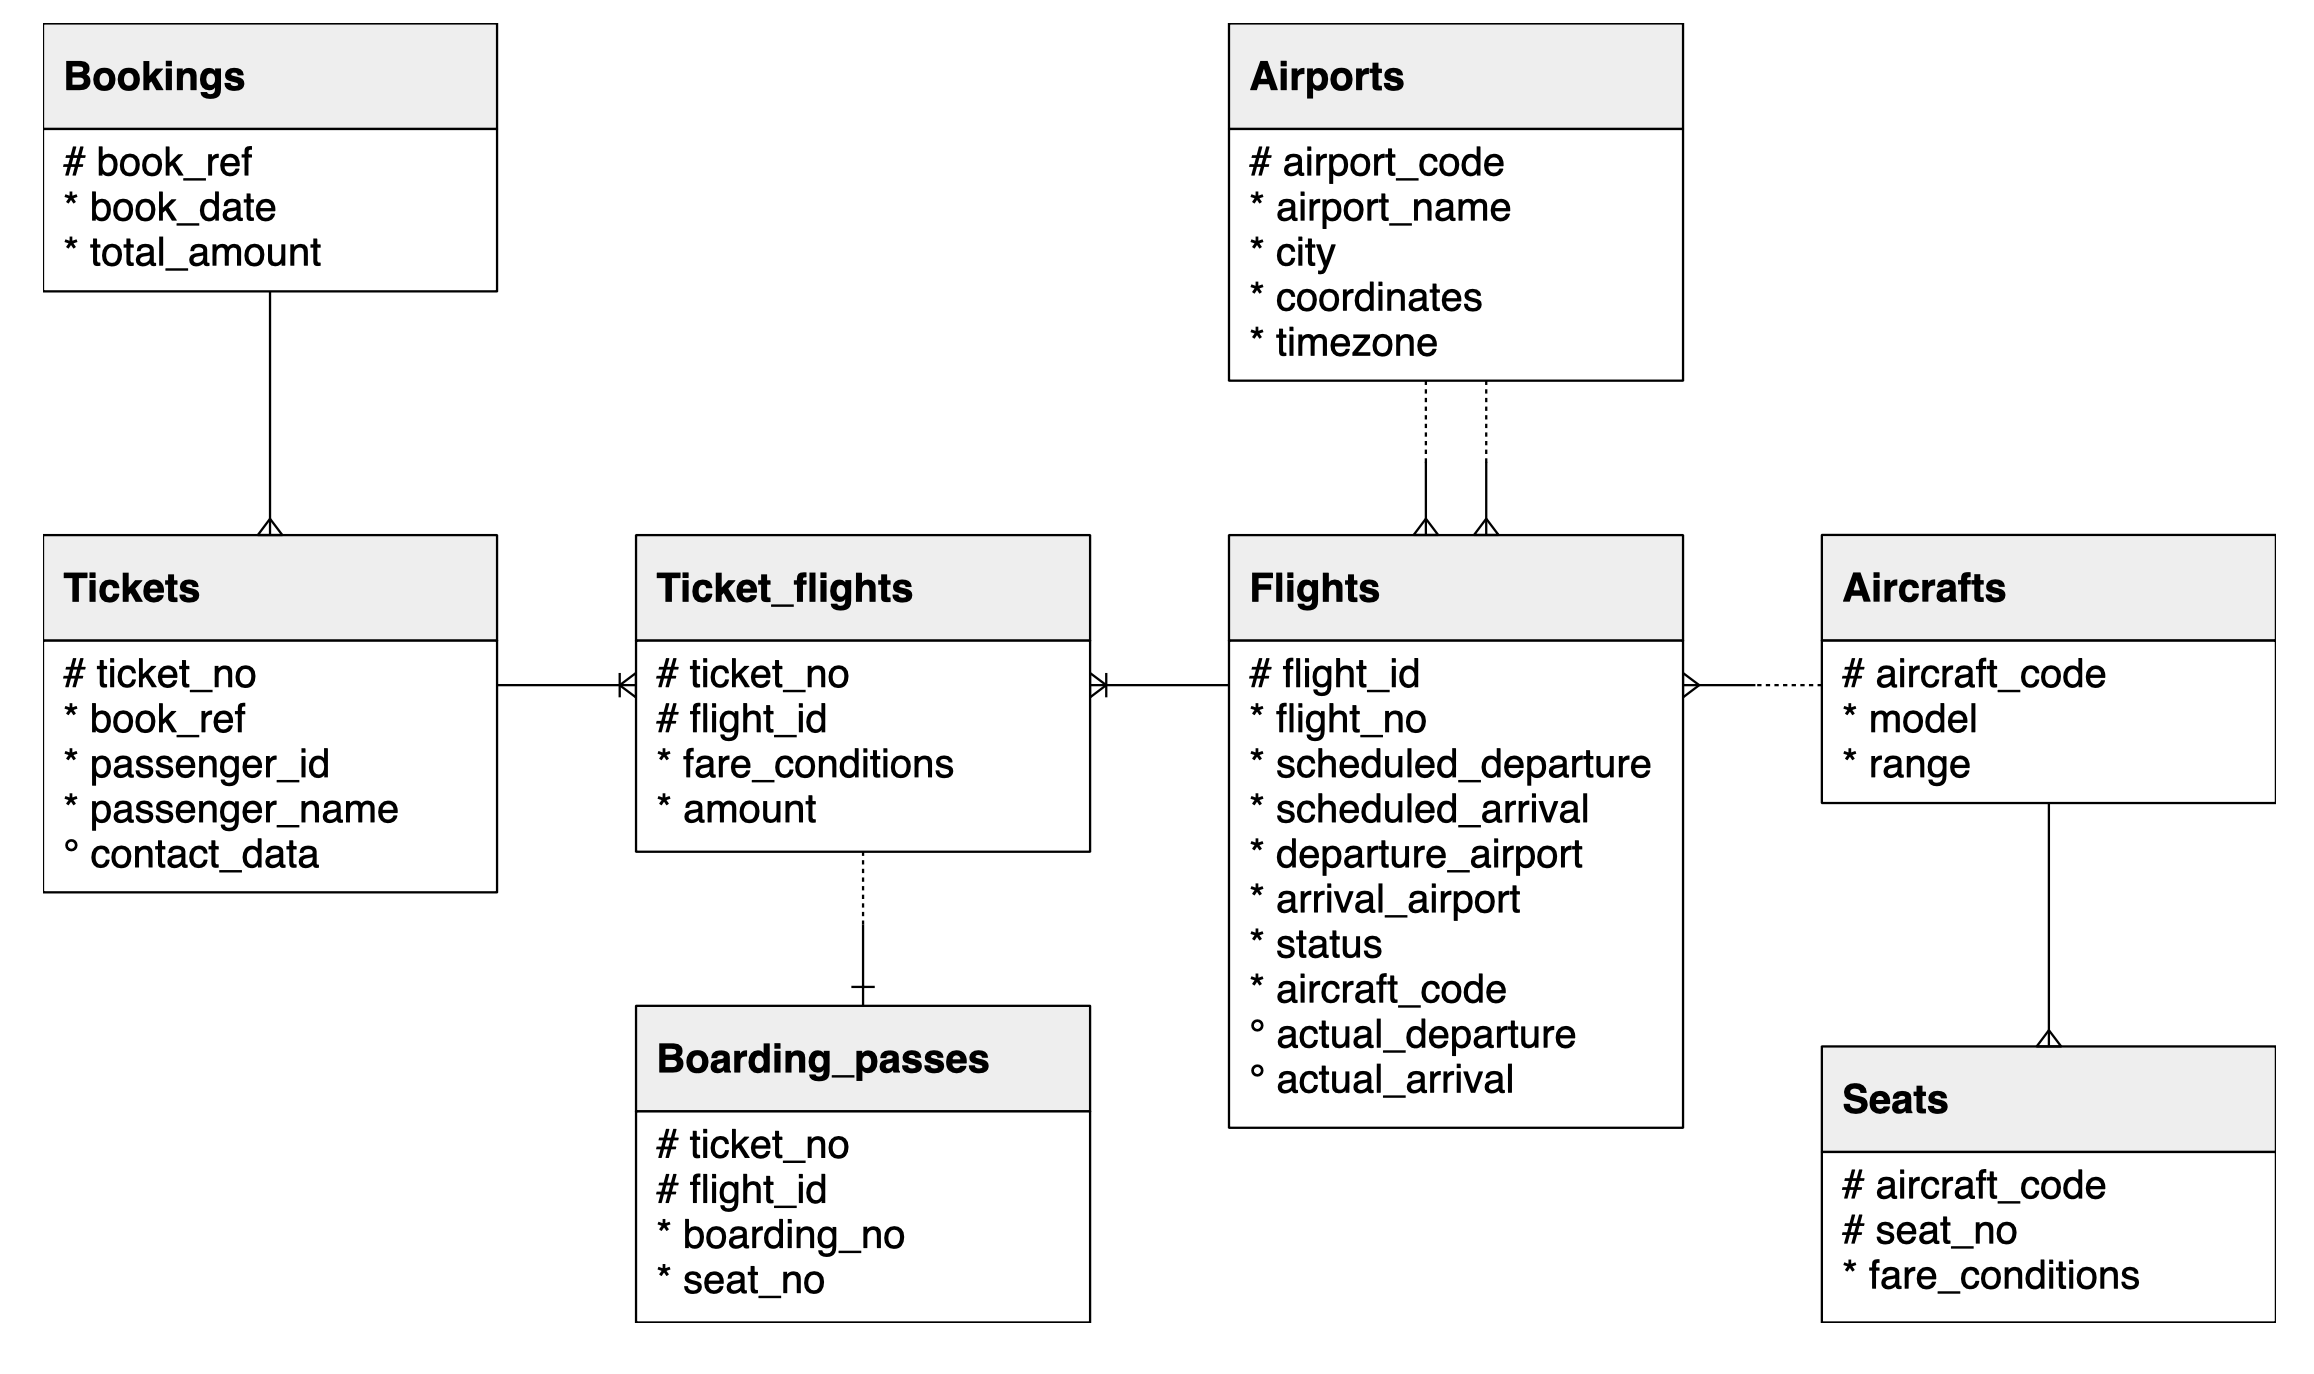
In this lab, you will use a database from https://postgrespro.com/education/demodb distributed under the PostgreSQL licence. It stores a month of data about airline flights in Russia and is organized according to the following schema:
Download Data
Since we’ll be using a cloud service some of the initial steps will vary.
- Start Server
- New terminal
- Download/import data
$ psql --username=postgres --host=localhost
psql (15.2 (Ubuntu 15.2-1.pgdg18.04+1), server 13.2)
Type "help" for help.

postgres=#
Create db from Script
postgres=# \i flights_RUSSIA_small.sql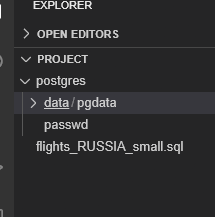
List Tables
demo=# \dt
               List of relations
  Schema  |      Name       | Type  |  Owner
----------+-----------------+-------+----------
 bookings | aircrafts_data  | table | postgres
 bookings | airports_data   | table | postgres
 bookings | boarding_passes | table | postgres
 bookings | bookings        | table | postgres
 bookings | flights         | table | postgres
 bookings | seats           | table | postgres
 bookings | ticket_flights  | table | postgres
 bookings | tickets         | table | postgres
(8 rows)
Monitor w CLI
Database monitoring refers to reviewing the operational status of your database and maintaining its health and performance. With proper and proactive monitoring, databases will be able to maintain a consistent performance. Any problems that emerge, such as sudden outages, can be identified and resolved in a timely manner.
Tools such as pgAdmin, an open source graphical user interface (GUI) tool for PostgreSQL, come with several features that can help monitor your database. The main focus in this lab will be using the command line interface to monitor your database, but we’ll also take a quick look at how the monitoring process can be replicated in pgAdmin.
Monitoring these statistics can be helpful in understanding your server and its databases, detecting any anomalies and problems that may arise.
Server Acivity
This query will retrieve the following:
| Column | Description |
|---|---|
| pid | Process ID |
| usename | Name of user logged in |
| datname | Name of database |
| state | Current state, with two common values being: active (executing a query) and idle (waiting for new command) |
| state_change | Time when the state was last changed |
This information comes from the pg_stat_activity, one of the built-in statistics provided by PostgreSQL.
- As you can see, there are currently 6 active connections to the server, with two of them being connected to databases that you’re familiar with. After all, you started in the default postgres database, which is now idle, and now you’re actively querying in the demo database.
- To see what other columns are available for viewing, feel free to take a look at the pg_stat_activity documentation!
demo=# SELECT pid, usename, datname, state, state_change FROM pg_stat_activity;

# OUTPUT
 pid  | usename  | datname | state  |         state_change
------+----------+---------+--------+-------------------------------
   43 |          |         |        |
   45 | postgres |         |        |
 1050 | postgres | demo    | active | 2012-10-03 13:14:20.153269+00
   41 |          |         |        |
   40 |          |         |        |
   42 |          |         |        |
(6 rows)
Monitor Last Query
Let’s say you wanted to see all the aforementioned columns, in addition to the actual text of the query that was last executed. Which column should you add to review that?
- If you wanted to see which query was most recently executed, you can add the query column.
- This column returns the most recent query.
- If state is active, it’ll show the currently executed query. If not, it’ll show the last query that was executed.
demo=# SELECT pid, usename, datname, state, state_change, query FROM pg_stat_activity;

# OUTPUT
 pid  | usename  | datname | state  |         state_change          |                                      query
------+----------+---------+--------+-------------------------------+---------------------------------------------------------------------------------
   43 |          |         |        |                               |
   45 | postgres |         |        |                               |
 1050 | postgres | demo    | active | 2024-10-03 13:18:45.030559+00 | SELECT pid, usename, datname, state, state_change, query FROM pg_stat_activity;
   41 |          |         |        |                               |
   40 |          |         |        |                               |
   42 |          |         |        |                               |
(6 rows)
Active Processes
To see which processes are active, you use the following query
demo=# SELECT pid, usename, datname, state, state_change, query FROM pg_stat_activity WHERE state = 'active';

# OUTPUT
 pid  | usename  | datname | state  |         state_change          |                                                 query
------+----------+---------+--------+-------------------------------+--------------------------------------------------------------------------------------------------------
 1050 | postgres | demo    | active | 2024-10-03 13:22:19.217489+00 | SELECT pid, usename, datname, state, state_change, query FROM pg_stat_activity WHERE state = 'active';
(1 row)
Database Activity
To look at db activity use the query below to extract:
| Column | Description |
|---|---|
| datname | Name of database |
| tup_inserted | Number of rows inserted by queries in this database |
| tup_updated | Number of rows updated by queries in this database |
| tup_deleted | Number of rows deleted by queries in this database |
This information comes from the pg_stat_database, one of the statistics provided by PostgreSQL.
demo=# SELECT datname, tup_inserted, tup_updated, tup_deleted FROM pg_stat_database;

# OUTPUT
  datname  | tup_inserted | tup_updated | tup_deleted
-----------+--------------+-------------+-------------
           |            2 |           1 |           0
 postgres  |            0 |           0 |           0
 demo      |      2290162 |          22 |           0
 template1 |            0 |           0 |           0
 template0 |            0 |           0 |           0
(5 rows)- As you can see, the two databases that are returned are the postgres and demo. These are databases that you are familiar with.
- The other two, template1 and template0 are default templates for databases, and can be overlooked in this analysis.
- Based on this output, you now know that demo had about 2,290,162 rows inserted and 22 rows updated.
- To see what other columns are available for viewing, you can read through the pg_stat_database documentation.
Monitor Rows Fetched
Let’s say you wanted to see the number or rows fetched and returned by this database. Note:
- The number of rows fetched is the number of rows that were returned.
- The number of rows returned is the number of rows that were read and scanned by the query.
- Notice how the rows returned tend to be greater than the rows fetched.
- If you consider how tables are read, this makes sense because not all the rows scanned may be the ones that are returned.
demo=# SELECT datname, tup_fetched, tup_returned FROM pg_stat_database;

# OUTPUT
  datname  | tup_fetched | tup_returned
-----------+-------------+--------------
           |        2113 |         2354ate, sta
 postgres  |        7086 |        43523
 demo      |      586118 |      8359082ate, sta
 template1 |           0 |            0
 template0 |           0 |            0
(5 rows)
One db Query
What if you only wanted to see the database details (rows inserted, updated, deleted, returned and fetched) for demo
demo=# SELECT datname, tup_inserted, tup_updated, tup_deleted, tup_fetched, tup_returned FROM pg_stat_database WHERE datname = 'demo';

# OUTPUT
 datname | tup_inserted | tup_updated | tup_deleted | tup_fetched | tup_returned
---------+--------------+-------------+-------------+-------------+--------------
 demo    |      2290162 |          22 |           0 |      586188 |      8364313
(1 row)
Performance over Time
Extensions, which can enhance your PostgreSQL experience, can be helpful in monitoring your database. One such extension is pg_stat_statements, which gives you an aggregated view of query statistics.
- To enable the extension, enter the following command
- This will enable the pg_stat_statements extension, which will start to track the statistics for your database.
demo=# CREATE EXTENSION pg_stat_statements;
CREATE EXTENSION
Edit Config File
- Now, let’s edit the PostgreSQL configuration file to include the extension you just added
- For the changes to take effect, you will have to restart your database.
demo=# ALTER SYSTEM SET shared_preload_libraries = 'pg_stat_statements';- You can do that by typing
exitin the terminal to stop your current session - Close the terminal and return to the PostgreSQL tab
- Select Stop
- Once the session has become inactive, select Start
Connect to db
- Now that you’ve restarted the server after altering the config file
- Connect to db
postgres=# \connect demo

# RESPONSE
psql (15.2 (Ubuntu 15.2-1.pgdg18.04+1), server 13.2)
You are now connected to database "demo" as user "postgres".
Verify Extension
Let’s verify the extension was added, and you can see the pg_stat_statements has been installed
demo=# \dx

# OUTPUT
                                            List of installed extensions
        Name        | Version |   Schema   |                              Description
--------------------+---------+------------+------------------------------------------------------------------------
 pg_stat_statements | 1.8     | bookings   | track planning and execution statistics of all SQL statements executed
 plpgsql            | 1.0     | pg_catalog | PL/pgSQL procedural language
(2 rows)
Check the shared_preload_libraries
demo=# show shared_preload_libraries;

 shared_preload_libraries
--------------------------
 pg_stat_statements
(1 row)
Turn on Expanded Table Formatting
Since the results returned by pg_stat_statements can be quite long, let’s turn on expanded table formatting with the following command. This will display the output in an expandable table format.
You can turn it off by running the same command again
demo=# \x
Expanded display is on.
Db ID
- From the pg_stat_statements documentation, you’ll see the various columns available to be retrieved.
- Let’s say we wanted to retrieve the db ID
- the query, and
- total time that it took to execute the statement (in milliseconds)
- Now you can scroll through the results
- Unlike pg_stat_activity, which showed the latest query that was run, pg_stat_statements shows an aggregated view of the queries that were run since the extension was installed.
demo=# SELECT dbid, query, total_exec_time FROM pg_stat_statements;


-[ RECORD 1 ]---+------------------------------------------------------------------------------------------------------------------------------------------------------------------------------------------------
dbid            | 16384
query           | SELECT e.extname AS "Name", e.extversion AS "Version", n.nspname AS "Schema", c.description AS "Description"                                                                                   +
                | FROM pg_catalog.pg_extension e LEFT JOIN pg_catalog.pg_namespace n ON n.oid = e.extnamespace LEFT JOIN pg_catalog.pg_description c ON c.objoid = e.oid AND c.classoid = $1::pg_catalog.regclass+
                | ORDER BY 1
total_exec_time | 0.197333
-[ RECORD 2 ]---+------------------------------------------------------------------------------------------------------------------------------------------------------------------------------------------------
dbid            | 16384
query           | show shared_preload_libraries
total_exec_time | 0.01642
Match ID to Db
- What if you wanted to find out which db matches the ID
- Based on this, you can now see that database ID 16384 is the demo database.
- This makes sense because you performed the query
show shared_preload librarieson the demo database, which appeared in pg_stat_statements.
demo=# SELECT oid, datname FROM pg_database;
-[ RECORD 1 ]------
oid     | 13442
datname | postgres
-[ RECORD 2 ]------
oid     | 16384
datname | demo
-[ RECORD 3 ]------
oid     | 1
datname | template1
-[ RECORD 4 ]------
oid     | 13441
datname | template0
Drop Extension
It’s important to note that adding these extensions can increase your server load, which may affect performance. If you need to drop the extension, you can achieve that with the following command
demo=# DROP EXTENSION pg_stat_statements;
DROP EXTENSION
Check Extensions List
Let’s check the list to make sure it has been deleted
demo=# \dx

List of installed extensions
-[ RECORD 1 ]-----------------------------
Name        | plpgsql
Version     | 1.0
Schema      | pg_catalog
Description | PL/pgSQL procedural language
Reset Config File
demo=# ALTER SYSTEM RESET shared_preload_libraries;
ALTER SYSTEM
List Extensions
Just as we did earlier, after altering the config file, we need to
- exit
- Stop server
- Restart
- Open Postgre CLI
- Connect to db
postgres=# \connect demo

demo=# \dx
# OUTPUT
                 List of installed extensions
  Name   | Version |   Schema   |         Description
---------+---------+------------+------------------------------
 plpgsql | 1.0     | pg_catalog | PL/pgSQL procedural language
(1 row)


demo=# show shared_preload_libraries;

# OUTPUT
 shared_preload_libraries
--------------------------

(1 row)
Monitor w pgAdmin
- Launch it
- Left menu > Servers > Password
- Home page = Dashboard
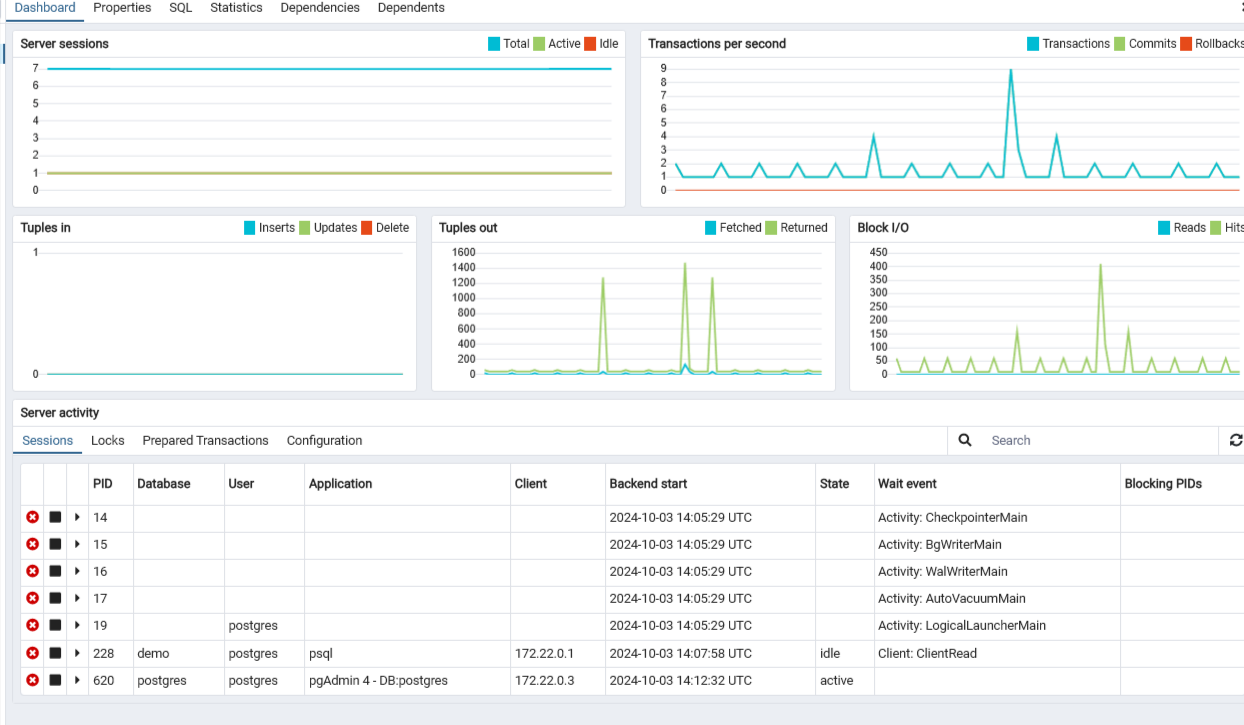
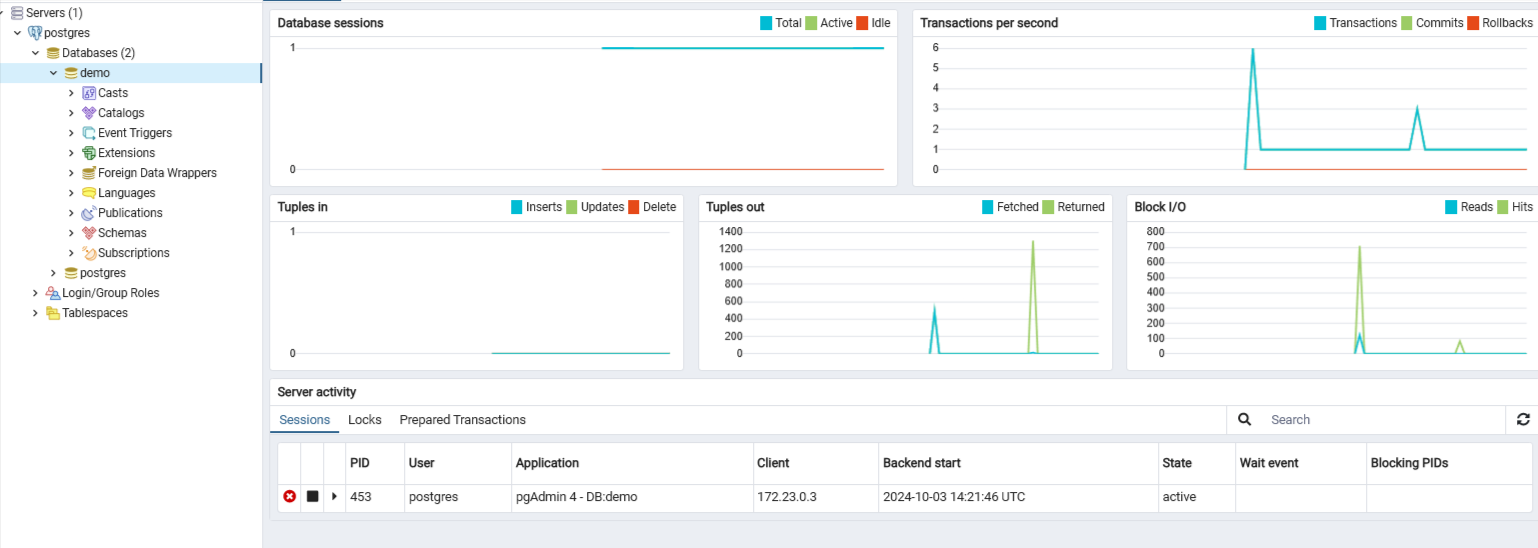
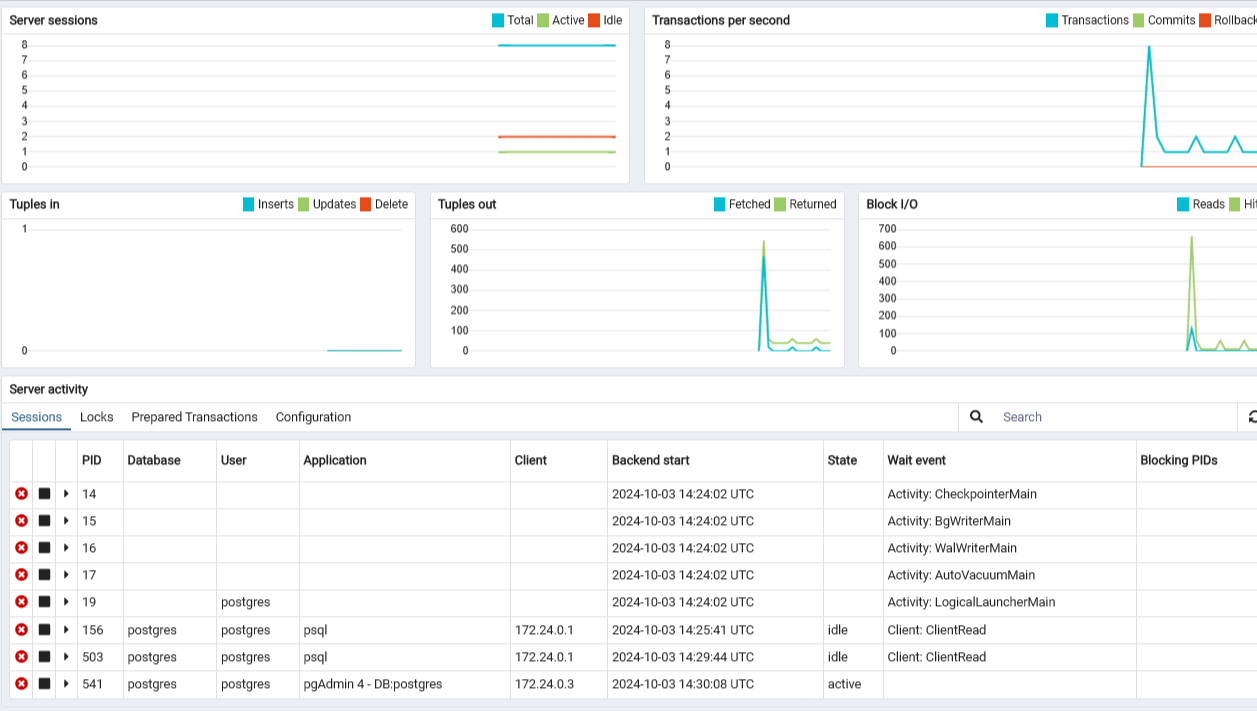
The table below lists the displayed statistics on the Dashboard that correspond with the statistics that we accessed with the CLI above
| Chart | Description |
|---|---|
| Server/Database sessions | Displays the total sessions that are running. For servers, this is similar to the pg_stat_activity, and for databases, this is similar to the pg_stat_database. |
| Transactions per second | Displays the commits, rollbacks, and transactions taking place. |
| Tuples in | Displays the number of tuples (rows) that have been inserted, updated, and deleted, similar to the tup_inserted, tup_updated, and tup_deleted columns from pg_stat_database. |
| Tuples out | Displays the number of tuples (rows) that have been fetched (returned as output) or returned (read or scanned). This is similar to tup_fetched and tup_returned from pg_stat_database. |
| Server activity | Displays the sessions, locks, prepared transactions, and configuration for the server. In the Sessions tab, it offers a look at the breakdown of the sessions that are currently active on the server, similar to the view provided by pg_stat_activity. To check for any new processes, you can select the refresh button at the top-right corner. |
Reset Charts
Stop server - All the charts above quiet down to zero
Wait till it’s inactive and
Click on Postgre CLI to start another instance
It might ask you for password again
You may have noticed that the Server sessions saw an increase of sessions. It increased from 7 to 8 sessions. This makes sense since you started a new session with PostgreSQL CLI.
To see that change reflected in Server Activity, you’ll have to click the refresh button to see that an additional postgres database session appeared.
Connect to db
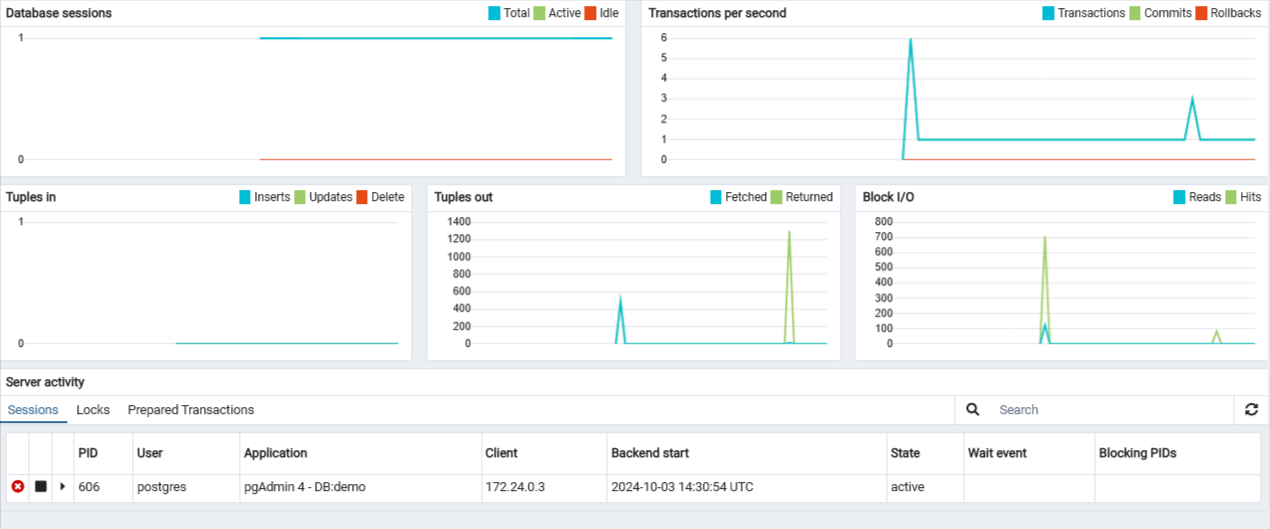
- Let’s connect to demo
- Left menu of pgAdmin
- Under postgres>Databases
- Click on demo to connect to the db
- Notice the number of tuples out
Run Query on db
- Let’s run a query on the database! To do that
- Navigate to the menu bar and select
Tools > Query Tool. or choose it from the tabs while in the demo database - You can run any query. To keep things simple, let’s run the following to select all the data from the bookings table
- You’ll see the results below the query screen
SELECT * FROM bookings;Db Activity
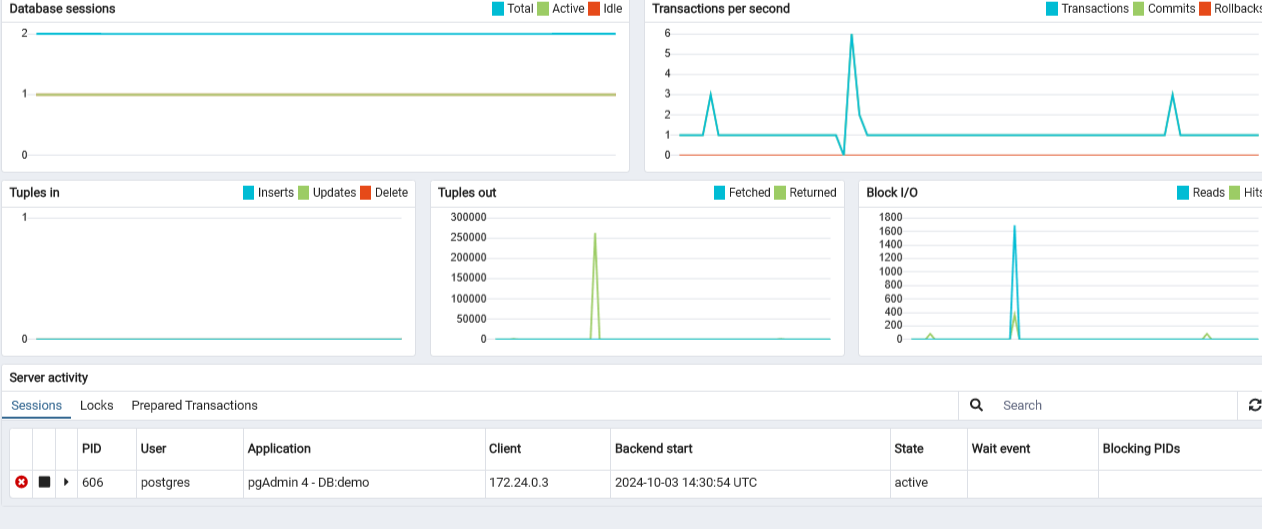
- Switch back to the db dashboard
- You can refresh the Server activity and check to see if any of the charts have shown a spike since the data was retrieved.
- You may have noticed that the number of tuples (rows) returned (read/scanned) was greater than 250,000.
Explain
- Check the number of rows scanned using a query
- f you can’t see the full text, simply drag the QUERY PLAN column out.
- This statement reveals that 263,887 rows were scanned, which is similar to the amount that was read/scanned based on the spike in the Tuples out chart.
EXPLAIN SELECT * FROM bookings;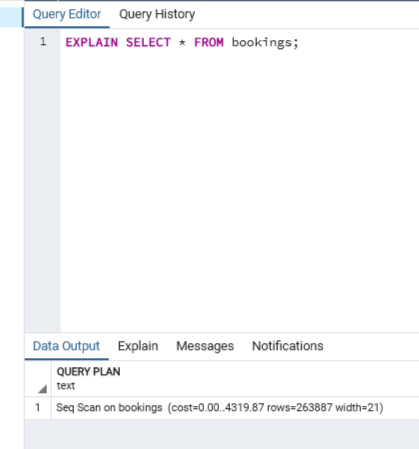
While you can monitor your database through the command line alone, tools like pgAdmin can be helpful in providing a visual representation of how your server and its databases are performing.
Optimize db
Data optimization is the maximization of the speed and efficiency of retrieving data from your database. Optimizing your database will improve its performance, whether that’s inserting or retrieving data from your database. Doing this will improve the experience of anyone interacting with the database.
Similar to MySQL, there are optimal data types and maintenance (otherwise known as “vacuuming”) that can be applied to optimize databases.
Optimize Data Types
When it comes to optimizing data types, understanding the data values will help in selecting the proper data type for the column.
Let’s take a look at an example in the demo database.
Return to the CLI session that you opened previously (or open a new session if it has been closed).
If you’re no longer conected to the demo database, you can reconnect to it!
postgres=# \connect demo
psql (15.2 (Ubuntu 15.2-1.pgdg18.04+1), server 13.2)
You are now connected to database "demo" as user "postgres".


demo=# \dt
               List of relations
  Schema  |      Name       | Type  |  Owner
----------+-----------------+-------+----------
 bookings | aircrafts_data  | table | postgres
 bookings | airports_data   | table | postgres
 bookings | boarding_passes | table | postgres
 bookings | bookings        | table | postgres
 bookings | flights         | table | postgres
 bookings | seats           | table | postgres
 bookings | ticket_flights  | table | postgres
 bookings | tickets         | table | postgres
(8 rows)
Let’s look at the data from the first table
demo=# SELECT * FROM aircrafts_data;
 aircraft_code |             model             | range
---------------+-------------------------------+-------
 773           | {"en": "Boeing 777-300"}      | 11100
 763           | {"en": "Boeing 767-300"}      |  7900
 SU9           | {"en": "Sukhoi Superjet-100"} |  3000
 320           | {"en": "Airbus A320-200"}     |  5700
 321           | {"en": "Airbus A321-200"}     |  5600
 319           | {"en": "Airbus A319-100"}     |  6700
 733           | {"en": "Boeing 737-300"}      |  4200
 CN1           | {"en": "Cessna 208 Caravan"}  |  1200
 CR2           | {"en": "Bombardier CRJ-200"}  |  2700
(9 rows)
You can see that there are 9 entries in total with three columns: aircraft_code, model, and range.
For our purposes, we’ll create a hypothetical situation that will potentially require changing the data types of columns to optimize them:
Let’s say that aircraft_code is always set to three characters
model will always be in a JSON format
range has a maximum value of 12,000 and minimum value of 1,000
Let’s change the types to:
aircraft_code: char(3), since you know that the aircraft code will always be fixed to three characters.
model: json, which is a special data type that PostgreSQL supports.
range: smallint, since the range of its numbers falls between -32,768 to 32,767.
Check Data Types
You can check the current data types (and additional details such as the indexes and constraints) of the aircrafts_data table with the following:
demo=# \d aircrafts_data

# OUTPUT
                Table "bookings.aircrafts_data"
    Column     |     Type     | Collation | Nullable | Default
---------------+--------------+-----------+----------+---------
 aircraft_code | character(3) |           | not null |
 model         | jsonb        |           | not null |
 range         | integer      |           | not null |
Indexes:
    "aircrafts_pkey" PRIMARY KEY, btree (aircraft_code)
Check constraints:
    "aircrafts_range_check" CHECK (range > 0)
Referenced by:
    TABLE "flights" CONSTRAINT "flights_aircraft_code_fkey" FOREIGN KEY (aircraft_code) REFERENCES aircrafts_data(aircraft_code)
TABLE "seats" CONSTRAINT "seats_aircraft_code_fkey" FOREIGN KEY (aircraft_code) REFERENCES aircrafts_data(aircraft_code) ON DELETE CASCADE- Notice that most of the columns in this table have been optimized for our sample scenario, except for the range.
- This may be because the range was unknown in the original database.
- Let’s take the opportunity to optimize that column for your hypothetical situation.
- You can do this by changing the data type of the column.
You’ll first need to drop a view, which is another way our data can be presented, in order to change the column’s data type. Otherwise, you will encounter an error. This is a special case for this database because you loaded a SQL file that included commands to create views. In your own database, you may not need to drop a view.
Drop View
demo=# DROP VIEW aircrafts;
DROP VIEW
Change Type
demo=# ALTER TABLE aircrafts_data ALTER COLUMN range TYPE smallint;
ALTER TABLE
Review
demo=# \d aircrafts_data
                Table "bookings.aircrafts_data"
    Column     |     Type     | Collation | Nullable | Default
---------------+--------------+-----------+----------+---------
 aircraft_code | character(3) |           | not null |
 model         | jsonb        |           | not null |
 range         | smallint     |           | not null |
Indexes:
    "aircrafts_pkey" PRIMARY KEY, btree (aircraft_code)
Check constraints:
    "aircrafts_range_check" CHECK (range > 0)
Referenced by:
    TABLE "flights" CONSTRAINT "flights_aircraft_code_fkey" FOREIGN KEY (aircraft_code) REFERENCES aircrafts_data(aircraft_code)
    TABLE "seats" CONSTRAINT "seats_aircraft_code_fkey" FOREIGN KEY (aircraft_code) REFERENCES aircrafts_data(aircraft_code) ON DELETE CASCADE
Vacuum Database
In your day-to-day life, you can vacuum our rooms to keep them neat and tidy. You can do the same with databases by maintaining and optimizing them with some vacuuming.
- In PostgreSQL, vacuuming means to clean out your databases by reclaiming any storage from “dead tuples”, otherwise known as rows that have been deleted but have not been cleaned out.
- Generally, the autovacuum feature is automatically enabled, meaning that PostgreSQL will automate the vacuum maintenance process for you.
- You can check if this is enabled with the following command:
demo=# show autovacuum;
 autovacuum
------------
 on
(1 row)- Since autovacuum is enabled, let’s check to see when your database was last vacuumed.
- To do that, you can use the pg_stat_user_tables, which displays statistics about each table that is a user table (instead of a system table) in the database.
- The columns that are returned are the same ones listed in pg_stat_all_tables documentation.
- What if you wanted to check the table (by name), the estimated number of dead rows that it has, the last time it was autovacuumed, and how many times it has been autovacuumed?
- To select the table name, number of dead rows, the last time it was autovacuumed, and the number of times this table has been autovacuumed, you can use the following query:
demo=# SELECT relname, n_dead_tup, last_autoanalyze, autovacuum_count FROM pg_stat_user_tables;

     relname     | n_dead_tup |       last_autoanalyze        | autovacuum_count
-----------------+------------+-------------------------------+------------------
 seats           |          0 | 2024-10-03 13:09:33.469043+00 |                2
 tickets         |        657 | 2024-10-03 13:09:38.983979+00 |                1
 aircrafts_data  |          9 |                               |                0
 flights         |        642 | 2024-10-03 13:09:33.453971+00 |                1
 bookings        |       1000 | 2024-10-03 13:09:32.98207+00  |                1
 ticket_flights  |       1000 | 2024-10-03 13:10:33.744129+00 |                1
 boarding_passes |       1000 | 2024-10-03 13:10:34.950993+00 |                1
 airports_data   |          0 | 2024-10-03 13:09:32.581493+00 |
Notice that you currently don’t have any “dead tuples” (deleted rows that haven’t yet been cleaned out) and so far, these tables have been autovacuumed once. This makes sense given that the database was just created and based on the logs, autovacuumed then.